Pendulum
The system consists of a mass and a rod that is connected to a fixed frame (as shown in the figure below). The system has a single rotational degree of freedom.
1) Modeling:
The schematic of a pendulum is shown in the following figure.
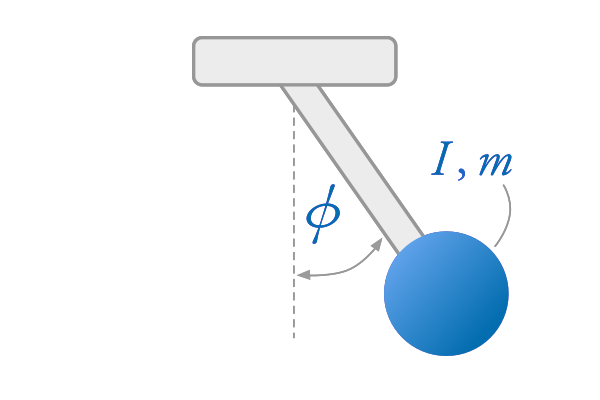
As seen in the free body diagram, we have one applied force (equals to 'mg') that is acting on the mass, and it is caused by gravity. The rod is assumed to be massless.
The equation of motion is as follows
$$ \begin{equation} I\ddot{\phi} = \sum M \end{equation} $$where 'I' denotes the moment of Inertia of the system and 'M' denotes the applied moments. So eq.1 reads: the moment of inertia times the angular acceleration of the mass is equal to the sum of moments acting on the system.
The moment of inertia of the system is equal to $ml^2$, which is the mass 'm' times the distance between the mass and the axis of rotation squared. The equation of motion is written as follows:
$$ \begin{equation} ml^2\ddot{\phi} = -mgl\sin(\phi) \end{equation} $$By harmonizing eq.2, we get:
$$ \begin{equation} ml^2\ddot{\phi} + mgl\sin(\phi) = 0 \end{equation} $$By dividing eq.3 by the term $ml^2$, we arrive at the following equation:
$$ \begin{equation} \ddot{\phi} + \frac{g}{l}\sin(\phi) = 0 \end{equation} $$The last equation, eq.4, is a nonlinear ordinary differential equation of second order that represents the dynamical behavior of the pendulum.
By assuming that the angle $\phi$ is small (i.e. $\sin(\phi) \rightarrow \phi$), we'll linearize the last equation to get a linear ODE:
$$ \begin{equation} \ddot{\phi} + \frac{g}{l}\phi = 0 \end{equation} $$Again, eq.4 is only valid for small angles, typically till 10° or 15°. The following figure depicts the response of the nonlinear and linear ODEs at high values of $\phi$.
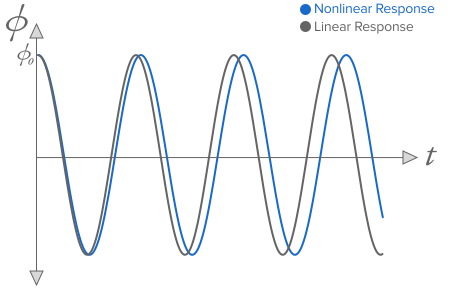
As you can see from figure 2, when the angle $\phi$ exceeds 15°, the response of the nonlinear and linear ODEs will not be identical. On the other hand, the response of the two ODEs are identical at low values of $\phi$.
We could represent the second order nonlinear ODE, defined by eq.4, as two first order ODEs as follows:
$$ \begin{equation} \dot{\phi}_1 = \phi_2 \end{equation} $$and
$$ \begin{equation} \dot{\phi}_2 = -\frac{g}{l}\sin(\phi_1) \end{equation} $$The last two equations form the nonlinear state space representation of the system, rewritten as follows:
$$ \begin{equation} \begin{bmatrix} \dot{\phi}_1 \\ \dot{\phi}_2 \end{bmatrix} = \begin{bmatrix} \phi_2 \\ -\frac{g}{l}\sin(\phi_1) \end{bmatrix} \end{equation} $$The nonlinear behavior of the pendulum is shown on a phase portrait in the following figure.
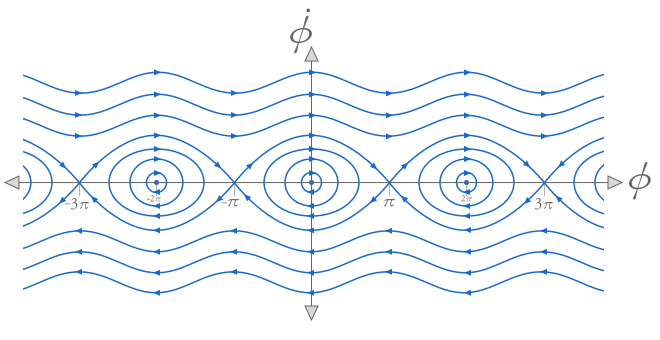
As can be seen, the critical points of the nonlinear pendulum are: (0,0), (± π,0), (±2π,0), (±3π,0), (±4π,0), (±5π,0), (±6π,0), and so on. The critical points that are surrounded by circles/eclipses are called centers, and they are stable. The other critical points, (±π,0), (±3π,0), (±5π,0),etc., are called saddle points, and they are unstable. The centers are the lower equilibrium points in the pendulum, and the saddle points are the upper equilibrium points of the pendulum.[Figure]
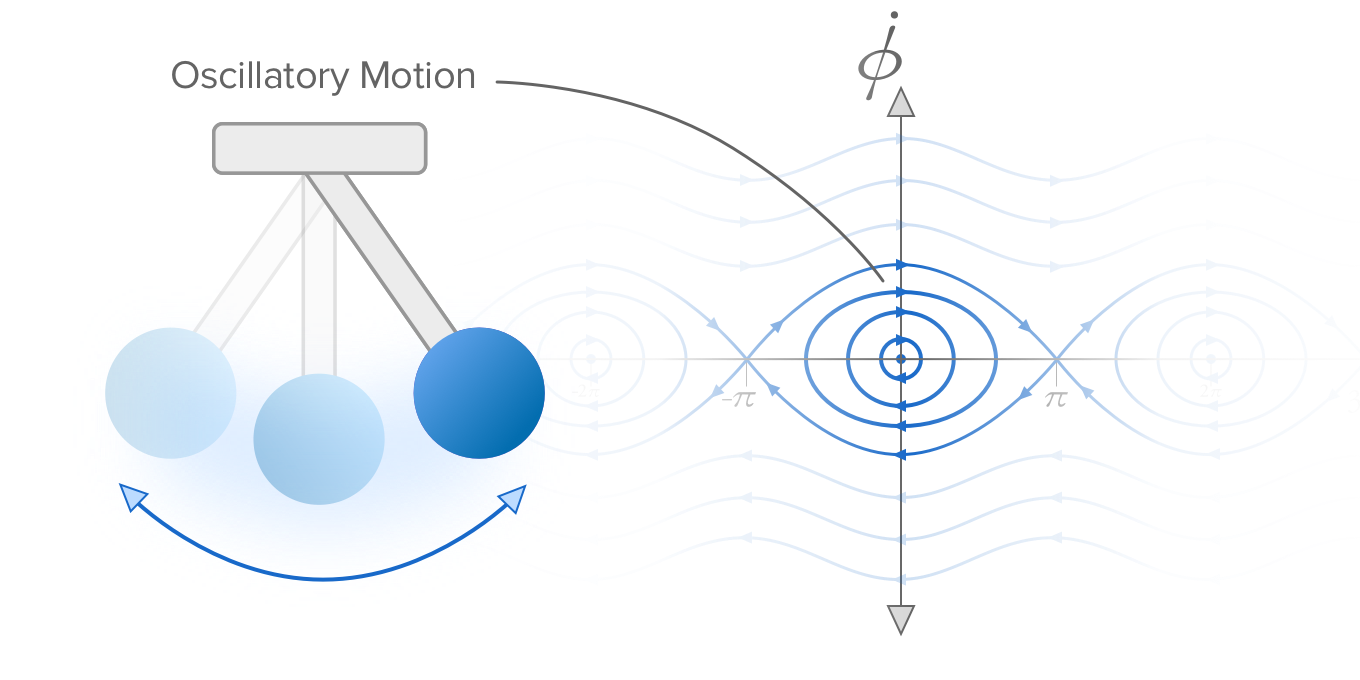
Different trajactories in the phase portrait represent different dynamical behavior of the pendulum, which results from various initial conditions applied to the pendulum. The first group of trajectories are represented by the circles/eclipses surrounding the centers. These circular trajectories define the oscillatory motion of the pendulum around the lower equilibrium point of the pendulum.
The second group of trajectories in figure 3 signifies the unstable behavior of the pendulum at the saddle point (i.e. the upper equilibrium point in the pendulum).[Figure]
The third group of trajectories in the phase plane shows the motion of the pendulum at high initial angular velocities, represented by the wavy trajectories seen in the higher and lower portions of figure 3. These wavy trajectories defines the rotational non-oscillatory motion of the pendulum at high angular velocities; in other words, the pendulum is continuously rotating whether in clockwise direction or the anticlockwise direction.[Figure]